Wednesday, November 28, 2012

Phylogenetic Tree Mega Table

Introduction

Here we present the summary of our work related with phylogenetic tree creation and visualization of Fungi data. The experiments were carried out primarily on two data sets, which we name as Fungi 200 and Fungi 2133. Details of these data sets are as follows.

Fungi 200

Fungi 2133

Note on 126 centers:
Originally we had 7 mega-regions in million sequence clustering project and they had a total of 140 clusters. Each cluster was represented by three center sequences of which were 126 is picked as the best.

Links

Following are links to previous posts on listed topics.
  1. The 200 sequence set without tree can be found here. The 2133 sequence set without tree can be found here.
  2. A description on tree generation methods is available here. 
  3. Tree quality comparisons of edge sum and correlation are available here.
  4. Heatmap comparisons,
    • pairwise edge sum distance versus other distance measures for leaf nodes is available here.
    • pairwise 10D, 3D, and SWG PID distances for leaf nodes is available here.
    • pairwise normalized score distance measures versus SWG PID is available here.
    • pairwise distance from multiple sequence alignment versus pairwise local alignment is available here.
  5. Robinson-Foulds metric for trees is available here. (summary of this given below as well)

Column Name Explanation

  1. Sequence Set: The two sequence sets as given above.
  2. Tree Generation Method: Multiple Sequence Alignment includes Clustal Omega, Clustal W2 and Muscle; Tree Generation includes FastTree, Raxml, Ninja and Neighbor Joining. Neighbor Joining is our implementation of method used in Ninja.
  3. Euclidean Mapping (Interpolation Method): Define leaf nodes as the sample set and internal nodes as out-of-sample set. Use leaf node positions in 3D or 10D from MDS. Calculate internal node positions in 3D or 10D respectively by "neighbor joining" formulae in wikipedia. However, tree itself is NOT defined necessarily by neighborhood joining but rather using the Tree Generation Method in previous column. Note that either Internal Node Interpolation and Full 3D map are used in Spherical Phylogram in following column.
    • Internal Node Interpolation (MI-MDS) was from Majorizing Iterative MDS method: The leaf nodes are fixed from basic MDS on them. Each node position has position calculated iteratively as it is added to the sample.
    • Full 3D map uses a full MDS for whole sample but fixes the leaf nodes at positions from their MDS (i.e. in same positions as Internal Node Interpolation). This gives improved results as all internal node mapped positions are varied simultaneously subject to distance matrix.
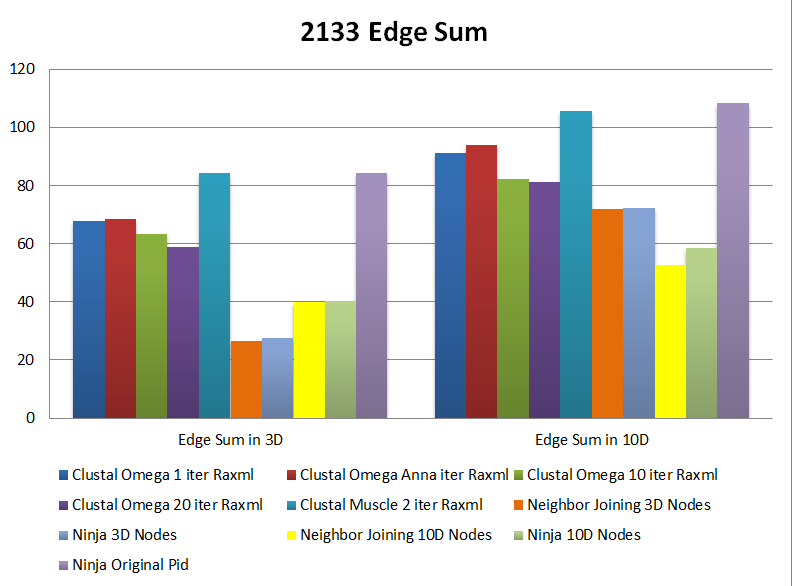
  4. Edge Sum: edge sum is the sum of all the edges' lengths, as in 3D, 10D using Euclidean mapping mentioned above.
    • Calculate tree by method defined in "Tree Generation Method" column and then calculate edge sum by one of three methods defined below. Note each method projects tree to a Euclidean space and uses Neighborhood Joining formulae for distances
      • 3D (3D) means instantiate tree in 3D and calculate edge sum in 3D, too;
      • 10D (10D) means instantiate tree in 10D and calculate edge sum in 10D, too;
      • 10D (3D) means instantiate tree in 10D and calculate edge sum in 3D after mapping 10D tree into 3D by MDS as described above.
  5. Stress: same definition as in dimension reduction techniques, calculate the error between target dimension Euclidean pairwise distance matrix to original dimension Eculidean pairwise distance matrix. In our particular calculation, it's the error from 10D to 3D dimension reduction, that error between target 3D and original 10D.
  6. Correlation: Simple correlation between leaf sum from newick file (each nodes' contains the distance from it to its direct parent) and original pid distance matrix / 3D plot distance matrix.
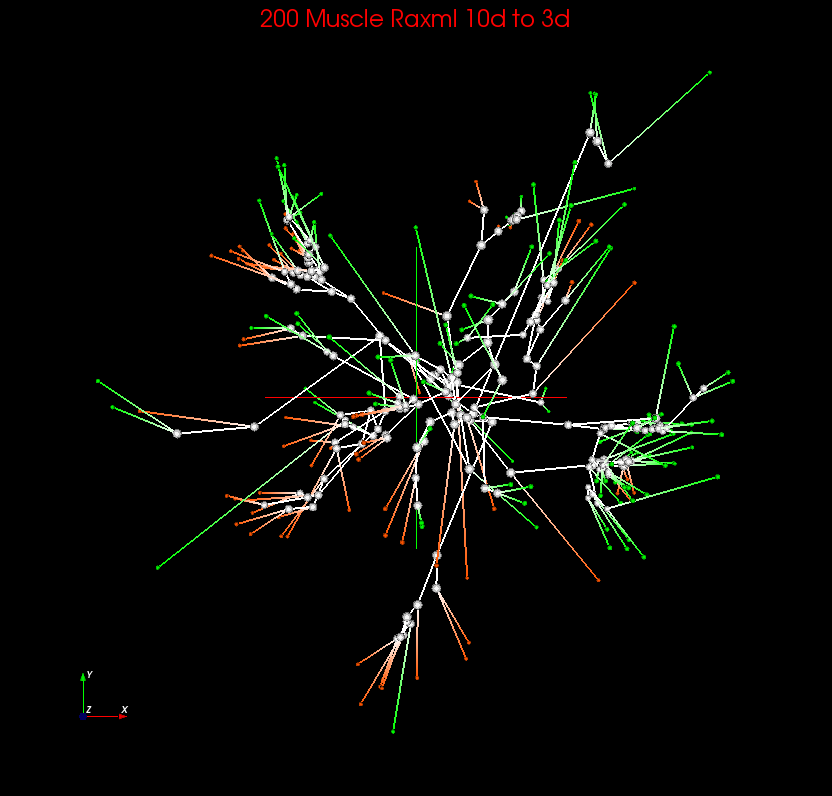
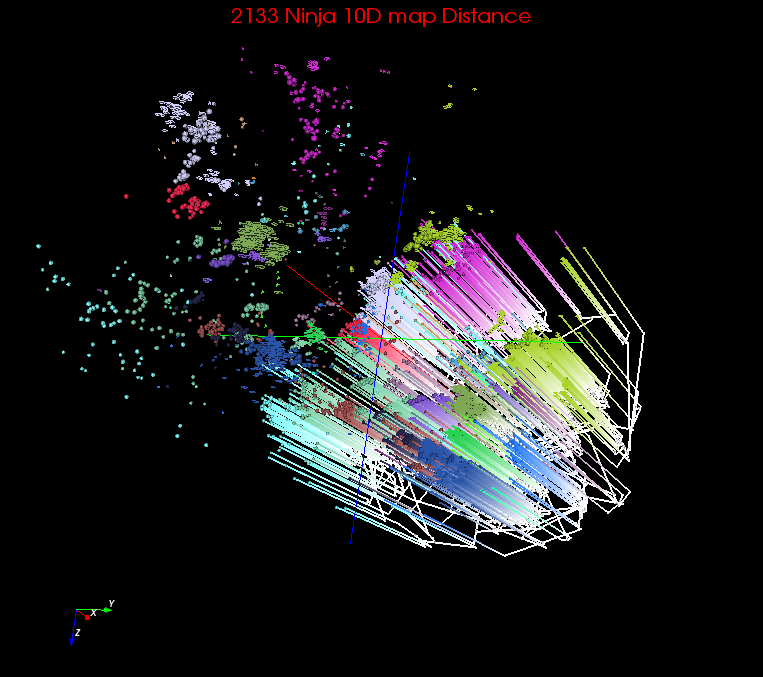
  7. Plots: Spherical is short for Spherical Phylogram, where it's similar to Circular Phylogram but also consider preserving the correlations among original sequences, the internal nodes are calculated using interpolation; Cuboid is short for Cuboid Cladogram, it's same as for Rectangular Cladogram, but in 3D. The internal nodes are NOT calculated by interpolation, but rather the middle of each pair of it's direct children; Rectangle is short for Rectangular Cladogram, where is generated using Dendroscope.
  8. Heatmap
    • Edgesum (newick) Vs Original PID compares the correlation of edge sum values versus original PID distance. More information is available at http://salsafungiphy.blogspot.com/2012/11/tree-distance-heatmaps.html
    • MI-MDS Vs Full MDS Mapping compares the correlation of pairwise node distances in trees built from internal node interpolation versus full 3D map.
    • MSA Strict PIDNG Vs SWG PID compares the computed percent identity excluding gaps from multiple sequence alignment versus pairwise Smith-Waterman percent identity distance. Only A, C, T, G characters are considered as the alphabet when computing PIDNG. See more information in http://salsafungiphy.blogspot.com/2012/10/pairwise-distances-from-multiple.html
    • MSA Full PIDNG Vs SWG PID similar to the previous column except A, C, M, G, R, S, V, T, W, Y, H, K, D, B, N characters are considered as the alphabet for PIDNG calculation. See more in http://salsafungiphy.blogspot.com/2012/10/pairwise-distances-from-multiple.html
  9. 2D View: It's selected screen shot from the 3D plots (in previous column) of Spherical Phylogram or Cuboid Cladogram (made using screen shot feature of 3D viewer Plotviz running on 3D plots in previous column) plus 2D rectangular cladogram in pdf format.

  10. Mega Information Table for PhyloTree Project
    Sequence Set Tree Generation Method Euclidean Mapping Edge Sum Stress
    10D (3D)
    Correlation
    Regular Tree
    Heat Map Plots 2D View
    3D (3D) 10D (10D) 10D (3D) With Original Pid With 3D MDS Map Edge Sum (Newick) vs Origin PID MI-MDS vs
    Full MDS Mapping
    MSA Strict PIDNG vs
    SWG PID
    MSA Full PIDNG vs
    SWG PID
    Rectangular Cladogram Cuboid Cladogram Spherical Phylogram
    126 + 74 (200) sequences
    Edge Sum Comparison Figure
    1. Clustal Omega FastTree Internal Node Interpolation 10.02 13.26 15.01 0.0264 -- -- Spherical
    Cuboid
    Rectangle
    Full 3D Map -- 11.29 0.0204
    2. Clustal Omega Raxml Internal Node Interpolation 11.33 14.62 16.15 0.0247 0.79 0.749 Spherical
    Cuboid
    Rectangle  
    Full 3D Map -- 13.05 0.02
    3. Clustal W2 FastTree Internal Node Interpolation 11.16 14.68 16.67 0.0277 -- -- Spherical 
    Cuboid
    Rectangle  
    Full 3D Map -- 13.4 0.0205
    4. Clustal W2 Raxml Internal Node Interpolation 11.99 15.08 16.17 0.025 0.825 0.78 Spherical 
    Cuboid
    Rectangle  
    Full 3D Map -- 13.69 0.0201
    5. Muscle FastTree Internal Node Interpolation 10.61 13.8 15.79 0.0274 -- --  Spherical 
    Cuboid
    Rectangle  
    Full 3D Map -- 12.31 0.0202
    6. Muscle Raxml Internal Node Interpolation 10.90 14.67 16.44 0.027 0.823 0.775 Spherical 
    Cuboid
    Rectangle  
    Full 3D Map
    -- 12.95 0.0202
    7. Neighbor Joining 3D Internal Node Interpolation 7.32 13.35 -- -- -- -- n/a n/a Spherical --
    Full 3D Map 7.33 -- -- --
    8. Ninja 3D plot Internal Node Interpolation 7.36 12.92 14.51 0.0268 0.787 0.774 n/a n/a Spherical
    Cuboid
    Rectangle  
    Full 3D Map -- 10.04 0.0198
    9. Neighbor Joining 10D Internal Node Interpolation 9.40 11.42 13.98 0.0285 -- -- n/a n/a Spherical --
    Full 3D Map -- 9.9 0.0202
    10. Ninja 10D plot Internal Node Interpolation 8.65 12.13 14.99 0.0283 0.906 0.834 n/a n/a  Spherical 
    Cuboid
    Rectangle  
    Full 3D Map -- 10.47 0.0207
    11. Ninja Original Pid Internal Node Interpolation 9.74 13.03 15.11 0.0273 0.925 0.855 n/a n/a  Spherical
    Cuboid
    Rectangle  

    Full 3D Map
    -- 11.67 0.0203
    126 + 74 + 988 + 945 (2133) sequences
    Edge Sum Comparison Figure
    A. Clustal Omega 1 iter Raxml Internal Node Interpolation 67.95 91.31 99.9 0.025 0.138 0.145
    Spherical 
    Cuboid

    Full 3D Map -- 90.76 0.0229
    B. Clustal Omega 1 iter FastTree Internal Node Interpolation 71.11
    104.65 -- -- Same as A Same as A Spherical
    Cuboid
    Full 3D Map --
    C. Clustal Omega Anna Raxml Internal Node Interpolation 68.34 93.91 102.23 0.025 0.679 0.714  Spherical 
    Cuboid
    Full 3D Map -- 93.18 0.0226
    D. Clustal Omega 10 iter Raxml Internal Node Interpolation 63.51 82.1 96.95 0.0262 0.272 0.284
    Spherical 
    Cuboid
    Rectangle
    Full 3D Map -- 82.25 0.0232
    E. Clustal Omega 20 iter Raxml Internal Node Interpolation 58.84 81.09 93.64 0.0252 0.275 0.288
    Spherical 
    Cuboid
    Rectangle
    Full 3D Map -- 80.88 0.0229
    F. Muscle 2 iter Raxml Internal Node Interpolation 84.23 105.52 113.82 0.0255 0.422 0.451
    Spherical 
    Cuboid
    Rectangle
    Full 3D Map -- 103.03 0.0229
    G. Neighbor Joining 3D Internal Node Interpolation 26.59 71.89 -- -- -- -- n/a n/a Spherical --
    Full 3D Map -- -- --
    H. Ninja 3D plot Internal Node Interpolation 27.59 72.12 86.45 0.0268 0.519 0.575 n/a n/a Spherical
    Cuboid
    Rectangle
    Full 3D Map -- 66.61 0.023
    I. Neighbor Joining 10D Internal Node Interpolation 39.85 52.56 81.68 0.028 -- -- n/a n/a Spherical --
    Full 3D Map -- 61.16 0.0233
    J. Ninja 10D transform Internal Node Interpolation 40.33 58.52 82.23 0.0264 0.728 0.781 n/a n/a Spherical
    Cuboid
    Rectangle
    Full 3D Map -- 63.41 0.0233
    K. Ninja Original Pid Internal Node Interpolation 84.21 108.51 114.85 0.0247 0.614 0.605 n/a n/a Spherical
    Cuboid
    Rectangle
    Full 3D Map -- 106.83 0.0224

    Distance Correlation with Original PID
    3D mapping 10D mapping
    200 Sequences 0.907 0.982
    2133 Sequences 0.804 0.885

    Robinson-Foulds Metric

  • Fungi 2133
    • Note. We have made the Ninja 10D transform tree (J) based on data from two MDS programs to verify they agree with each other. The one mentioned in the above table uses the 10 dimensional coordinates generated for each leaf node of the tree using a deterministic annealed (DA) SMACOF MDS program. We have also produced 10 dimensional coordinates for the leaf nodes using a Chisquared MDS program. The tree J is created using Ninja by giving the 10 dimensional Euclidean pairwise distances of leaf nodes. The tree based on former MDS is named as J SMACOF MDS and the other as J Chisq MDS in the below Robinson-Foulds metric.

Reference:
  • Yang Ruan, Geoffrey House, Saliya Ekanayake, Ursel Schütte, James D. Bever, Haixu Tang, Geoffrey Fox. Integration of Clustering and Multidimensional Scaling to Determine Phylogenetic Trees as Spherical Phylograms Visualized in 3 Dimensions. Proceedings of C4Bio 2014 of IEEE/ACM CCGrid 2014, Chicago, USA, May 26-29, 2014.
  • Yang Ruan, Geoffrey Fox. A Robust and Scalable Solution for Interpolative Multidimensional Scaling with Weighting. Proceedings of IEEE eScience 2013, Beijing, China, Oct. 22-Oct. 25, 2013. (Best Student Innovation Award)
  • Yang Ruan, Saliya Ekanayake, Mina Rho, Haixu Tang, Seung-Hee Bae, Judy Qiu, Geoffrey Fox. DACIDR: Deterministic Annealed Clustering with Interpolative Dimension Reduction using a Large Collection of 16S rRNA Sequences. Proceedings of ACM-BCB 2012, Orlando, Florida, ACM, Oct. 7-Oct. 10, 2012.
  • Yang Ruan, Zhenhua Guo, Yuduo Zhou, Judy Qiu, Geoffrey Fox. HyMR: a Hybrid MapReduce Workflow System. Proceedings of ECMLS’12 of ACM HPDC 2012, Delft, Netherlands, ACM, Jun. 18-Jun. 22, 2012
  • Adam Hughes, Yang Ruan, Saliya Ekanayake, Seung-Hee Bae, Qunfeng Dong, Mina Rho, Judy Qiu, Geoffrey Fox. Interpolative Multidimensional Scaling Techniques for the Identification of Clusters in Very Large Sequence Sets, BMC Bioinformatics 2012, 13(Suppl 2):S9.
  • Sunday, November 25, 2012

    Tree Quality Comparison with Different Measures


    Abstract

    In the Tree Wrap Up Session post, we listed different phylogenetic tree plot created by various multiple sequence alignment method and tree generation method. We have two different dataset, one is 200 sequence set and the other one is 2133 sequence set, used for spherical phylogram and cuboid cladogram. In this post, we use canonical correlation analysis (CCA) and edge sum to compare the quality of these different plot, hopefully could tell the advantages of different methods applied on 3D phylogenetic tree visualization plot.

    Description

    Environment: Single machine for 200, PolarGrid for 2133 sequences
    Aligner: SmithWaterman
    ScoringMatrix: EDNAFULL
    GapOpen: -16
    GapExt: -4
    DistanceType: Percentage Identity
    Method: all varied
    WithReverse: dynamic determine algorithm
    Multiple Sequence Alignment: Clustal Omega, Clustal W2 and Muscle
    Tree Generation Method: Raxml, Fast Tree, Ninja and Neighbor Joining.

    Dataset

    1. 200 sequences:
    1) 126 new centers from fungi454 (id: 0 ~ 125)
    2) 74 sequences from GenBank; (id: 126 ~ 199)
    2. 2133 sequences:
    1) 126 new centers from fungi454 (id: 0 ~ 125)
    2) 74 sequences from GenBank; (id: 126 ~ 199)
    3) 988 unique sequences from Wittiya; (id: 200 ~ 1187, original 1013 sequences)
    4) 945 unique sequences from Kruger; (id: 1188 ~ 2132, original 1130 sequences)

    Tree Configuration

    Level configuration: 
    larger size means higher level in tree
    Color scheme:
    1) Spherical Phylogram
    fungi454: Green
    GenBank: Orange
    Wittiya: Yellow
    Kruger: Blue
    2) Cuboid Cladogram
    Colored by branches, 200 sequence set use 20 points per branch, 2133 sequence set use 300 points per branch

    Tree Evaluation Method

    We have two ways of comparing the tree quality:
    One is to calculate the distance between each pair of leaf nodes using the distance calculation from here. The distance from leaf node A to leaf node B is the sum of AA and BB. Then we analysis the distance matrix by comparing it to the original distance matrix using CCA. Theoretically if the distance calculation from the tree MAKE SENSE, the correlation should be higher if a tree's quality is better, which we are not sure about the distance calculation method from here.
    Another method is to calculate the sum of the edges in the target dimensional space. A cleaner and better looking plot could potentially mean a better phylogenetic tree for analysis. Because the smaller edge sum is, the ancestor of each closed pair of species is closer to them in the target dimension space, which makes sense for evolution theory.

    Result

    From both CCA and Edge Sum comparison the 200 sequences set with all different methods performs well. This means for a small sequence set (hundreds of sequences), either different Multiple Sequence Alignment methods such as Clustal Omega, Clustal W2, Muscle, and tree generation methods such as Neighbor Joining, Ninja, Fast Tree and Raxml doesn't make very much difference. All the methods could successfully determine the phylogeny evolution pattern while not interrupting the original correlations exists in the input species.
    However, when sequence size expands, in our case, to 2133 sequences, the original MSA/Raxml methods performs much worse than Ninja and Neighbor Joining in either CCA and Edge Sum.
    We also notice that Ninja has the same result to Neighbor Joining in the edge sum calculation, which is because these two are basically same methods but Ninja is with a faster approach. And Fast Tree always has a lower edge sum than Raxml, which means it preserves the original correlation better than Raxml for 200 sequence set.

    CCA Comparison


     Edge Sum Comparison


    Additional Correlation Comparison between 10D plot distance, 3D plot distance and original pid distance


    Tuesday, November 20, 2012

    Heatmaps of 10D vs 3D vs SWG

    Here we list heatmaps of distances resulted from dimensional scaling versus original Smith-Waterman for two datasets. The description of distances is as follows.

    • SWG PID
    • 10D
      • The 10 dimensional Euclidean distance based on DA-SMACOF mapping of SWG PID
    • 3D
      • The 3 dimensional Euclidean distance based on DA-SMACOF mapping of SWG PID

    The two datasets are described at http://salsafungiphy.blogspot.com/2012/11/tree-distance-heatmaps.html


    Heatmaps for Fungi 200


    3D DA-SMACOF of SWG PID Vs SWG PID

    10D DA-SMACOF of SWG PID Vs SWG PID

    3.)whole-plot-DASMACOF-SWG-PID-Vs-SWG-PIDDensitySat[0.85]-large whole-plot-dasamcof.10D-Vs-swg.pidDensitySat[0.85]-large


    10D DA-SMACOF of SWG PID Vs 3D DA-SMACOF of SWG PID

     
    whole-plot-dasamcof.10D-Vs-dasmacof.3DDensitySat[0.85]-large  


    Heatmaps for Fungi 2133

    3D DA-SMACOF of SWG PID Vs SWG PID

    10D DA-SMACOF of SWG PID Vs SWG PID

    whole-plot-DASMACOF-SWG-PID-Vs-SWG-PIDDensitySat[0.85]-large whole-plot-dasamcof.10D-Vs-swg.pidDensitySat[0.85]-large


    10D DA-SMACOF of SWG PID Vs 3D DA-SMACOF of SWG PID

     
    whole-plot-dasamcof.10D-Vs-dasmacof.3DDensitySat[0.85]-large  


    Friday, November 9, 2012

    Phylogenetic Tree Generation for 200/2133 sequences


    Abstract

    Traditional phylogenetic tree viewing method includes different graph of following:
    Rectangular phylogram, rectangular cladogram, circular phylogram, circular cladogram, slanted phylogram and slated cladogram.
    All these methods can present the distance from actual sequence (leaf node) to their parents (internal node) precisely. However, there is no way to observe the corrleations between the leaf nodes.
    We proposed a new way of presenting phylogenetic trees, where not only the evolution of the species is shown, but also the relations between different taxas can be observed directly to each other (not through their ancestors). The spherical phylogram and cuboid cladogram (previously called side tree) has been added to our dimension reduction result for thousands of sequences. Not only we used a neighbor joining algorithm to show the structure of the tree based on that, but also we use interpolation for other phylogenetic tree generation method, such as Raxml, Ninja and Fast Tree. 

    Description

    Environment: Single machine for 200, PolarGrid for 2133 sequences
    Aligner: SmithWaterman
    ScoringMatrix: EDNAFULL
    GapOpen: -16
    GapExt: -4
    DistanceType: Percentage Identity
    Method: all varied
    WithReverse: dynamic determine algorithm
    Multiple Sequence Alignment: Clustal Omega, Clustal W2 and Muscle
    Tree Generation Method: Raxml, Fast Tree, Ninja and Neighbor Joining.

    Dataset

    1. 200 sequences:
    1) 126 new centers from fungi454 (id: 0 ~ 125)
    2) 74 sequences from GenBank; (id: 126 ~ 199)
    2. 2133 sequences:
    1) 126 new centers from fungi454 (id: 0 ~ 125)
    2) 74 sequences from GenBank; (id: 126 ~ 199)
    3) 988 unique sequences from Wittiya; (id: 200 ~ 1187, original 1013 sequences)
    4) 945 unique sequences from Kruger; (id: 1188 ~ 2132, original 1130 sequences)

    Tree Configuration

    Level configuration: 
    larger size means higher level in tree
    Color scheme:
    1) Spherical Phylogram
    fungi454: Green
    GenBank: Orange
    Wittiya: Yellow
    Kruger: Blue
    2) Cuboid Cladogram
    Colored by branches, 200 sequence set use 20 points per branch, 2133 sequence set use 300 points per branch

    Final Result

    Speherical Phylogram and Cuboid Cladogram are in pviz format, need to use PlotViz3 to open. The Rectangle Cladogram is in pdf format.
    1. 200 sequence set result:
    1) Clustal Omega with Fast Tree: Spherical Phylogram/Cuboid Cladogram/Rectangle Cladogram
    2) Clustal Omega with Raxml: Spherical Phylogram/Cuboid Cladogram/Rectangle Cladogram
    3) Clustal W2 with Fast Tree: Spherical Phylogram/Cuboid Cladogram/Rectangle Cladogram
    4) Clustal W2 with Raxml: Spherical Phylogram/Cuboid Cladogram/Rectangle Cladogram
    5) Muscle with Fast Tree: Spherical Phylogram/Cuboid Cladogram/Rectangle Cladogram
    6) Muscle with Raxml: Spherical Phylogram/Cuboid Cladogram/Rectangle Cladogram
    7) Ninja with Original SWG Pid Distance: Spherical Phylogram/Cuboid Cladogram/Rectangle Cladogram
    8) Ninja with 10D Pid Distance: Spherical Phylogram/Cuboid Cladogram/Rectangle Cladogram
    9) Neighbor Joining with 3D plot Distance: Spherical Phylogram

    2. 2133 sequence set result:
    1) Clustal Omega 1 iteration with Raxml: Spherical Phylogram/Cuboid Cladogram/Rectangle Cladogram
    2) Clustal Omega 1 iteration (Anna's edition) with Raxml: Spherical Phylogram/Cuboid Cladogram/Rectangle Cladogram
    3) Clustal Omega 10 iterations with Raxml: Spherical Phylogram/Cuboid Cladogram/Rectangle Cladogram
    4) Clustal Omega 20 iterations with Raxml: Spherical Phylogram/Cuboid Cladogram/Rectangle Cladogram
    5) Muscle 2 iterations with Raxml: Spherical Phylogram/Cuboid Cladogram/Rectangle Cladogram
    6) Ninja with Original SWG Pid Distance: Spherical Phylogram/Cuboid Cladogram/Rectangle Cladogram
    7) Ninja with 3D plot Distance: Spherical Phylogram/Cuboid Cladogram/Rectangle Cladogram
    8) Ninja with 10d Pid Distance: Spherical Phylogram/Cuboid Cladogram/Rectangle Cladogram
    9) Neighbor Joining with 3D plot Distance: Spherical Phylogram

    Screen Shot

    With PlotViz, we are able to show sequences in a spherical phylogram with their name shown or not, here is a screen shot from 200 sample neighbor joining algorithm from 3D plot distance:

    The cuboid plot from Ninja using 3D plot distance is shown as below:
    Part of the cuboid tree can be hidden to make some more interesting branches shown in a clear fashion:


    Monday, November 5, 2012

    Tree Distance Heatmaps

    This is an attempt to find a “goodness” measure for phylogenetic trees generated by programs such as Ninja (http://nimbletwist.com/software/ninja/index.html) or RAxML (http://www.phylo.org/news/RAxML). We calculate distance, which we refer as “Tree Distance”,  for each pair of sequences based on the structure of the tree. We then compare this against original pairwise distances computed for sequences based on either local alignment or multiple sequence alignment. Definition for tree distance is not unique and we currently use the “Edge Sum” definition given below. Edge Count is possibly another definition to test, though we have not tested it yet.
    • Edge Sum
      • Given two sequence A and B, we find the shortest path from A to B in the tree and sum up values on edges along the path.
    • Edge Count
      • Given two sequence A and B, we find the shortest path from A to B and count the number of edges in it.
    We have performed this analysis for two datasets.

    Heatmaps for Fungi 200

    3D DA-SMACOF of SWG PID Vs SWG PID
     
    3.)whole-plot-DASMACOF-SWG-PID-Vs-SWG-PIDDensitySat[0.85]-large  


    Edge Sum Ninja from SWG PID Vs 3D DA-SMACOF of SWG PID
    Edge Sum Ninja from SWG PID Vs SWG PID
    1.)whole-plot-Ninja-Edgesum-Vs-DASMACOF-SWG-PIDDensitySat[0.85]-large 2.)whole-plot-Ninja-Edgesum-Vs-SWG-PIDDensitySat[0.85]-large

    Heatmaps of Fungi 2133

    3D DA-SMACOF of SWG PID Vs SWG PID
     
    whole-plot-DASMACOF-SWG-PID-Vs-SWG-PIDDensitySat[0.85]-large  


    Edge Sum Ninja from 3D DA-SMACOF of SWG PID Vs 3D DA-SMACOF of SWG PID
    Edge Sum Ninja from 3D DA-SMACOF of SWG PID Vs SWG PID
    whole-plot-Ninja-Edgesum-Vs-DASMACOF-SWG-PIDDensitySat[0.85]-large whole-plot-Ninja-Edgesum-Vs-SWG-PIDDensitySat[0.85]-large


    Edge Sum RAxML(20 iterations) from ClustlO MSA Vs SWG PID
    Edge Sum RAxML (20 iterations) from ClustlO MSA (distances from 0 to 0.15) Vs SWG PID
    whole-plot-Raxml(20)ClustlO-Edgesum-Vs-SWG-PIDDensitySat[0.85]-large-1 whole-plot-Raxml(20)ClustlO-Edgesum-Vs-SWG-PIDDensitySat[0.85]-large-2


    Edge SumRAxML(20 iterations) from ClustlO MSA Vs Strict PIDNG
    Edge Sum RAxML (20 iterations) from ClustlO MSA (distances from 0 to 0.15) Vs Strict PIDNG
    whole-plot-Raxml(20)ClustlO-Edgesum-Vs-Strict-PIDNGDensitySat[0.85]-large-1 whole-plot-Raxml(20)ClustlO-Edgesum-Vs-Strict-PIDNGDensitySat[0.85]-large-2

    Wednesday, October 24, 2012

    Pairwise Distances from Multiple Sequence Alignment (MSA) Vs Pairwise Local Alignment Distances

    Here we have compared the pairwise distances calculated from a multiple sequence alignment (MSA) file versus pairwise distances calculated from the local pairwise alignment of sequences.
    The comparison is based on the sequences found here. MSA corresponding to this can be found here.
    • Distances
      • We computed the percent identity excluding gaps (PIDNG) distance for each pair of aligned sequences in the MSA file. The formula is to count the number of identical base pairs and divide it by the total number base pairs. Each base pair should have characters belonging to the given alphabet to be considered in the computation. To convert this value to represent the distance between two sequences we subtract it from 1.0.
        • PIDNG Distance = 1.0 – PIDNG
        • where PIDNG = # Identical Pairs / # Pairs  and both characters in each pair belongs to the given alphabet.
      • We compute percent identity (PID) distance for each pair of sequences in the original sequence (FastA) file after aligning them locally using Smith-Waterman algorithm. For a given alignment of the two sequences, PID is calculated similarly to PIDNG except those pairs  whose one character is a gap are also counted towards the total number of pairs in the alignment. Similar to PIDNG distance we take the 1.0 – PID to get PID distance.
        • PID Distance = 1.0 – PID
        • where PID =  # Identical Pairs / # Pairs
    • Alphabet
      • Strict DNA
        • Considers only A, C, T, G characters
      • Full DNA
        • Considers A, C, M, G, R, S, V, T, W, Y, H, K, D, B, N characters
      • We computed PIDNG distance for MSA file using both alphabets
      • We computed PID distance for locally aligned sequences using Full DNA, but excluding character N.
    • Smith-Waterman Parameters
      • Scoring Matrix
        • EDNAFULL
      • Penalties
        • Gap open = –16 and gap extension = – 4
    • Heatmaps
    Strict DNA Alphabet for MSA PIDNG Calculation
    Full DNA Alphabet for MSA PIDNG Calculation
    whole-plot-MSA-PIDNG-Vs-Pairwise-SWG-PIDDensitySat[0.85]-large whole-plot-MSA-PIDNG-Vs-Pairwise-SWG-PIDDensitySat[0.85]-large

    Monday, October 8, 2012

    Heatmaps of Different Distances

    • The type of distances
      • PID – #-of-matches / alignment-length-including-gaps-in-the-middle
      • AvgLocal – Score(A,B) / Avg (Score(A’A’), Score(B’,B’)) where A’ and B’ indicate the aligned regions in the original A and B sequences
      • MaxGlobal – Score(A,B) / Max(Score(A,A), Score(B,B))
      • MaxLocal – Score(A,B) / Max(Score(A’A’, B’B’)
      • MinGlobal – Score(A,B) / Min(Score(A,A), Score(B,B))
      • MinLocal – Score(A,B) / Min(Score(A’A’), Score(B’B’))

    • Heatmaps for vs PID
      • AvgLocal Vs PID
      • MaxGlobal Vs PID
    whole-plot-SWG-AvgLocal-Vs-SWG-PIDDensitySat[0.85]-large whole-plot-SWG-MaxGlobal-Vs-SWG-PIDDensitySat[0.85]-large
      • MaxLocal Vs PID
      • MinGlobal Vs PID
    whole-plot-SWG-MaxLocal-Vs-SWG-PIDDensitySat[0.85]-large whole-plot-SWG-MinGlobal-Vs-SWG-PIDDensitySat[0.85]-large
      • MinLcal Vs PID
    whole-plot-SWG-MinLocal-Vs-SWG-PIDDensitySat[0.85]-large


    • Heatmaps of vs AvgLocal
      • MaxGlobal Vs AvgLocal
      • MaxLocal Vs AvgLocal
    whole-plot-SWG-MaxGlobal-Vs-SWG-AvgLocalDensitySat[0.85]-large whole-plot-SWG-MaxLocal-Vs-SWG-AvgLocalDensitySat[0.85]-large
      • MinGlobal Vs AvgLocal
      • MinLocal Vs AvgLocal
    whole-plot-SWG-MinGlobal-Vs-SWG-AvgLocalDensitySat[0.85]-large whole-plot-SWG-MinLocal-Vs-SWG-AvgLocalDensitySat[0.85]-large

    • Heatmaps of vs MaxGlobal
      • MaxLocal Vs MaxGlobal
      • MinGlobal Vs MaxGlobal
    whole-plot-SWG-MaxLocal-Vs-SWG-MaxGlobalDensitySat[0.85]-large whole-plot-SWG-MinGlobal-Vs-SWG-MaxGlobalDensitySat[0.85]-large
      • MinLocal Vs MaxGlobal
    whole-plot-SWG-MinLocal-Vs-SWG-MaxGlobalDensitySat[0.85]-large

    • Heatmaps of vs MaxLocal
      • MinGlobal Vs MaxLocal
      • MinLocal Vs MaxLocal
    whole-plot-SWG-MinGlobal-Vs-SWG-MaxLocalDensitySat[0.85]-large whole-plot-SWG-MinLocal-Vs-SWG-MaxLocalDensitySat[0.85]-large

    • Heatmaps of vs MinLocal
      • MinLocal Vs MinGlobal
    whole-plot-SWG-MinLocal-Vs-SWG-MinGlobalDensitySat[0.85]-large