Abstract
In the Tree Wrap Up Session post, we listed different phylogenetic tree plot created by various multiple sequence alignment method and tree generation method. We have two different dataset, one is 200 sequence set and the other one is 2133 sequence set, used for spherical phylogram and cuboid cladogram. In this post, we use canonical correlation analysis (CCA) and edge sum to compare the quality of these different plot, hopefully could tell the advantages of different methods applied on 3D phylogenetic tree visualization plot.
Description
Environment: Single machine for 200, PolarGrid for 2133 sequencesAligner: SmithWaterman
ScoringMatrix: EDNAFULL
GapOpen: -16
GapExt: -4
DistanceType: Percentage Identity
Method: all varied
WithReverse: dynamic determine algorithm
Multiple Sequence Alignment: Clustal Omega, Clustal W2 and Muscle
Tree Generation Method: Raxml, Fast Tree, Ninja and Neighbor Joining.
Dataset
1. 200 sequences:1) 126 new centers from fungi454 (id: 0 ~ 125)
2) 74 sequences from GenBank; (id: 126 ~ 199)
2. 2133 sequences:
1) 126 new centers from fungi454 (id: 0 ~ 125)
2) 74 sequences from GenBank; (id: 126 ~ 199)
3) 988 unique sequences from Wittiya; (id: 200 ~ 1187, original 1013 sequences)
4) 945 unique sequences from Kruger; (id: 1188 ~ 2132, original 1130 sequences)
Tree Configuration
Level configuration:
larger size means higher level in tree
Color scheme:
1) Spherical Phylogram
fungi454: Green
GenBank: Orange
Wittiya: Yellow
Kruger: Blue
2) Cuboid Cladogram
Colored by branches, 200 sequence set use 20 points per branch, 2133 sequence set use 300 points per branch
Tree Evaluation Method
We have two ways of comparing the tree quality:
One is to calculate the distance between each pair of leaf nodes using the distance calculation from here. The distance from leaf node A to leaf node B is the sum of AA and BB. Then we analysis the distance matrix by comparing it to the original distance matrix using CCA. Theoretically if the distance calculation from the tree MAKE SENSE, the correlation should be higher if a tree's quality is better, which we are not sure about the distance calculation method from here.
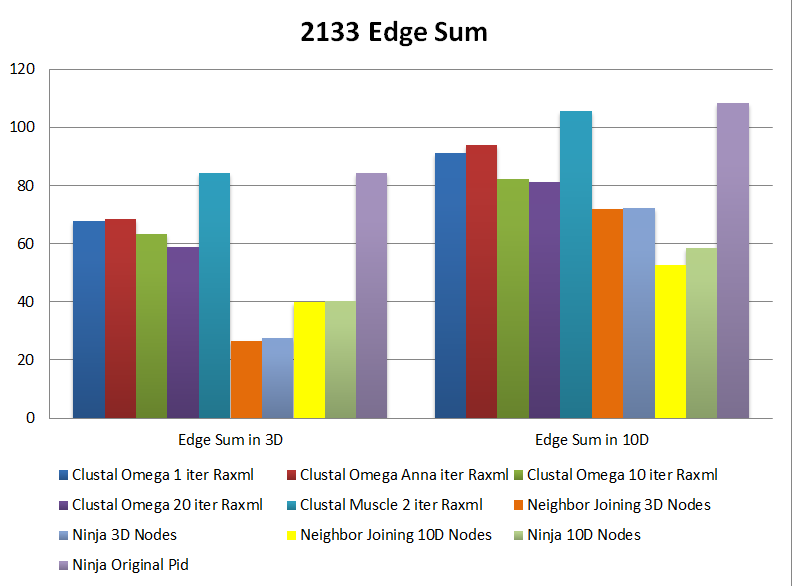
Another method is to calculate the sum of the edges in the target dimensional space. A cleaner and better looking plot could potentially mean a better phylogenetic tree for analysis. Because the smaller edge sum is, the ancestor of each closed pair of species is closer to them in the target dimension space, which makes sense for evolution theory.
One is to calculate the distance between each pair of leaf nodes using the distance calculation from here. The distance from leaf node A to leaf node B is the sum of AA and BB. Then we analysis the distance matrix by comparing it to the original distance matrix using CCA. Theoretically if the distance calculation from the tree MAKE SENSE, the correlation should be higher if a tree's quality is better, which we are not sure about the distance calculation method from here.
Another method is to calculate the sum of the edges in the target dimensional space. A cleaner and better looking plot could potentially mean a better phylogenetic tree for analysis. Because the smaller edge sum is, the ancestor of each closed pair of species is closer to them in the target dimension space, which makes sense for evolution theory.
Result
From both CCA and Edge Sum comparison the 200 sequences set with all different methods performs well. This means for a small sequence set (hundreds of sequences), either different Multiple Sequence Alignment methods such as Clustal Omega, Clustal W2, Muscle, and tree generation methods such as Neighbor Joining, Ninja, Fast Tree and Raxml doesn't make very much difference. All the methods could successfully determine the phylogeny evolution pattern while not interrupting the original correlations exists in the input species.
However, when sequence size expands, in our case, to 2133 sequences, the original MSA/Raxml methods performs much worse than Ninja and Neighbor Joining in either CCA and Edge Sum.
We also notice that Ninja has the same result to Neighbor Joining in the edge sum calculation, which is because these two are basically same methods but Ninja is with a faster approach. And Fast Tree always has a lower edge sum than Raxml, which means it preserves the original correlation better than Raxml for 200 sequence set.
CCA Comparison


Edge Sum Comparison

Additional Correlation Comparison between 10D plot distance, 3D plot distance and original pid distance

No comments:
Post a Comment